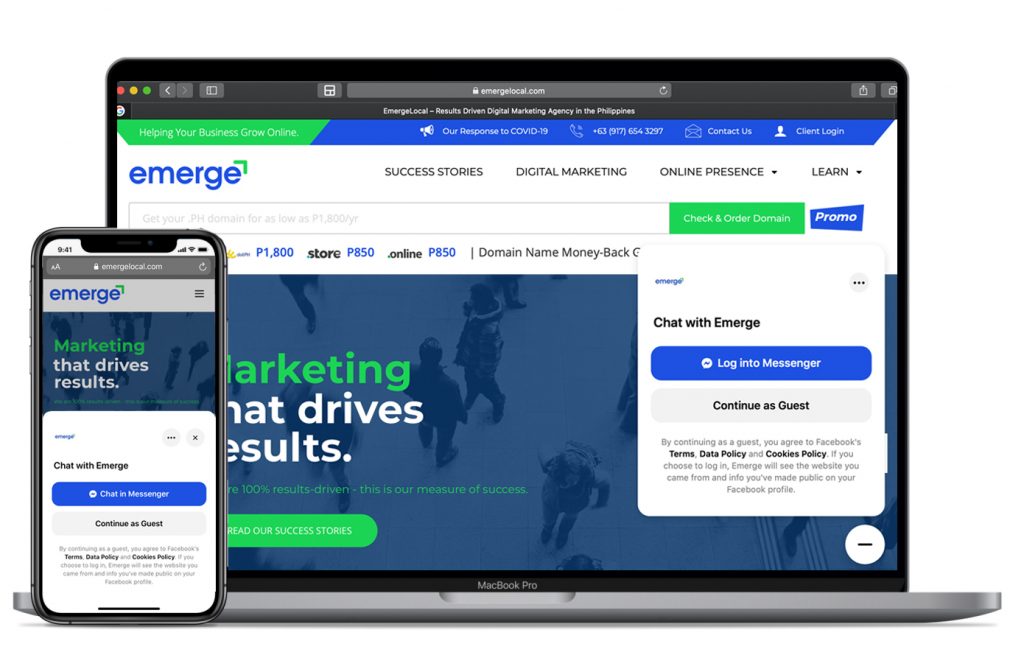
Our Blog, Facebook Advertising, Social MediaFacebook rolls out a Major Update of Messenger’s Chat Plugin That Allows Businesses to Communicate With Non-Facebook Consumers Richard Noromor / August 7, 2020
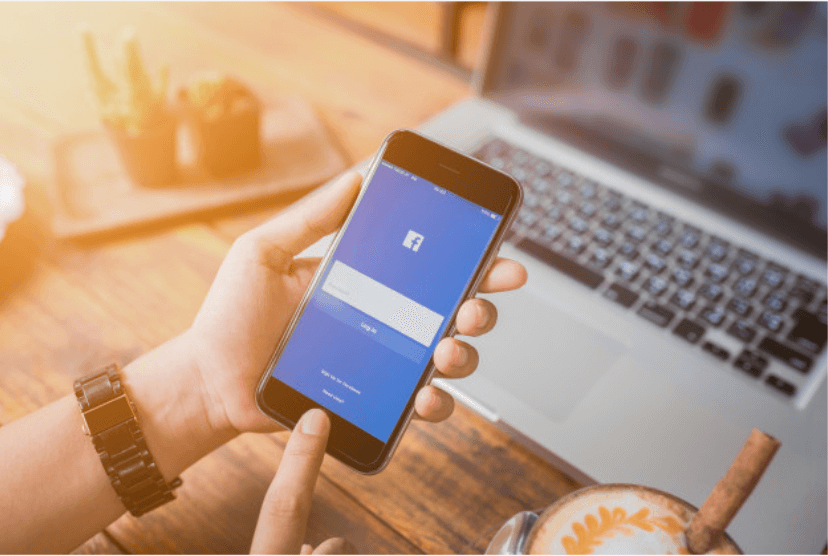
Our Blog, Online Marketing, Social Media[Report] 70% of consumers in Southeast Asia will go digital by end 2020 Richard Noromor / August 7, 2020
Our Blog, Social Media, Social Media Marketing PhilippinesFacebook Insights: A Guide for Growing Your Business Page Jim Merino / May 31, 2019
Our Blog, Digital Marketing, Facebook Advertising, Social Media, Social Media Marketing PhilippinesMilk Tea Advertisement | How to Advertise Milk Tea in Social Media Carissa Noromor / May 22, 2019
Our Blog, Digital Marketing, Facebook Advertising, Online Marketing, Search Engine Optimization, Social Media‘Tis the Season to Prep Your Website For The Holidays In October Carissa Noromor / October 13, 2017
Our Blog, How To's, Social MediaHow Smart Digital Marketers Use Facebook Messenger for outstanding Customer Service Carissa Noromor / July 31, 2017
Our Blog, Facebook Advertising, How To's, Social MediaHow To Increase Facebook Page Likes And Engagements Using Video For FB Ads Carissa Noromor / July 31, 2017
Our Blog, Facebook Advertising, How To's, Social MediaHow To Keep Your Facebook Fans Engaged Carissa Noromor / July 31, 2017
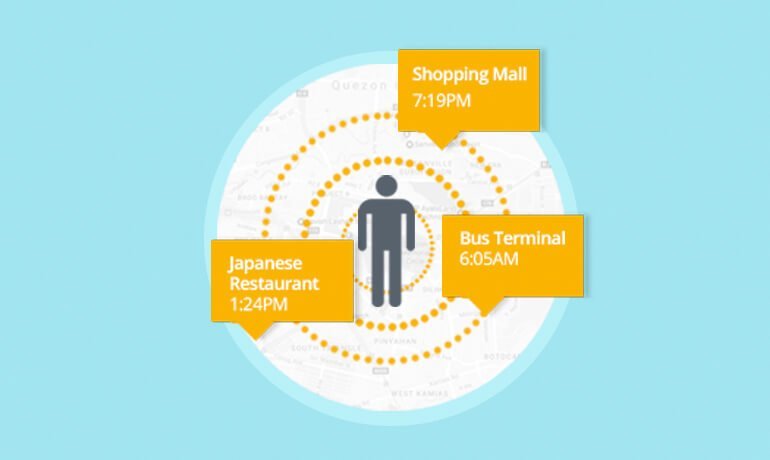
Our Blog, How To's, Social MediaA quick 3 step guide to setup Geo Targeting in Facebook Carissa Noromor / July 31, 2017
Our Blog, Instagram Ads, Social Media3 Instagram Tips For Small Businesses and Startups in the Philippines Carissa Noromor / July 31, 2017